World War I Global Military Powers & Rankings
| Rank | Empire / Power | Peak Mobilized Forces | Tanks | Combat Aircraft | Dreadnoughts/Fleet | Peak War GDP | Historical Dossier |
|---|---|---|---|---|---|---|---|
| #1 |
 German Empire |
13.250.000 | 20 | 5.200 | 42 | $244B | Profile |
| #2 |
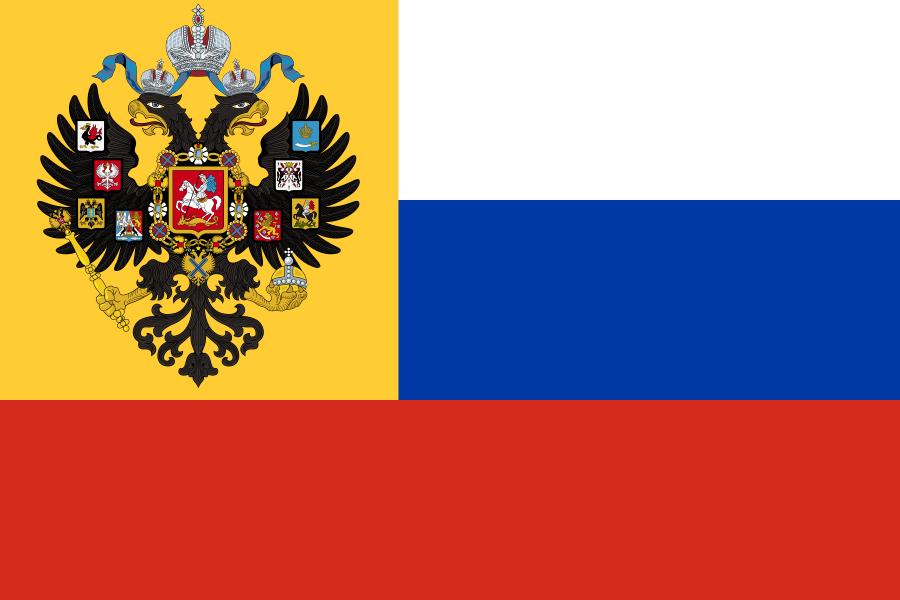 Russian Empire |
12.000.000 | 0 | 1.200 | 18 | $257B | Profile |
| #3 |
 British Empire |
8.904.000 | 2.636 | 6.500 | 85 | $290B | Profile |
| #4 |
 French Republic |
8.410.000 | 3.870 | 5.800 | 26 | $144B | Profile |
| #5 |
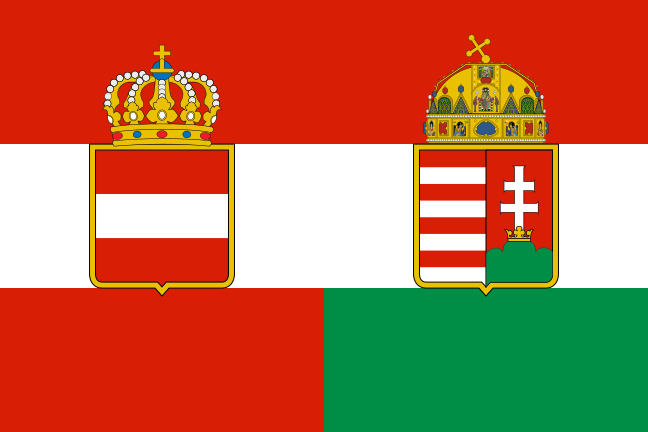 Austro-Hungarian Empire |
7.800.000 | 0 | 1.100 | 16 | $100B | Profile |
| #6 |
 United States of America |
4.355.000 | 84 | 3.200 | 50 | $650B | Profile |
| #7 |
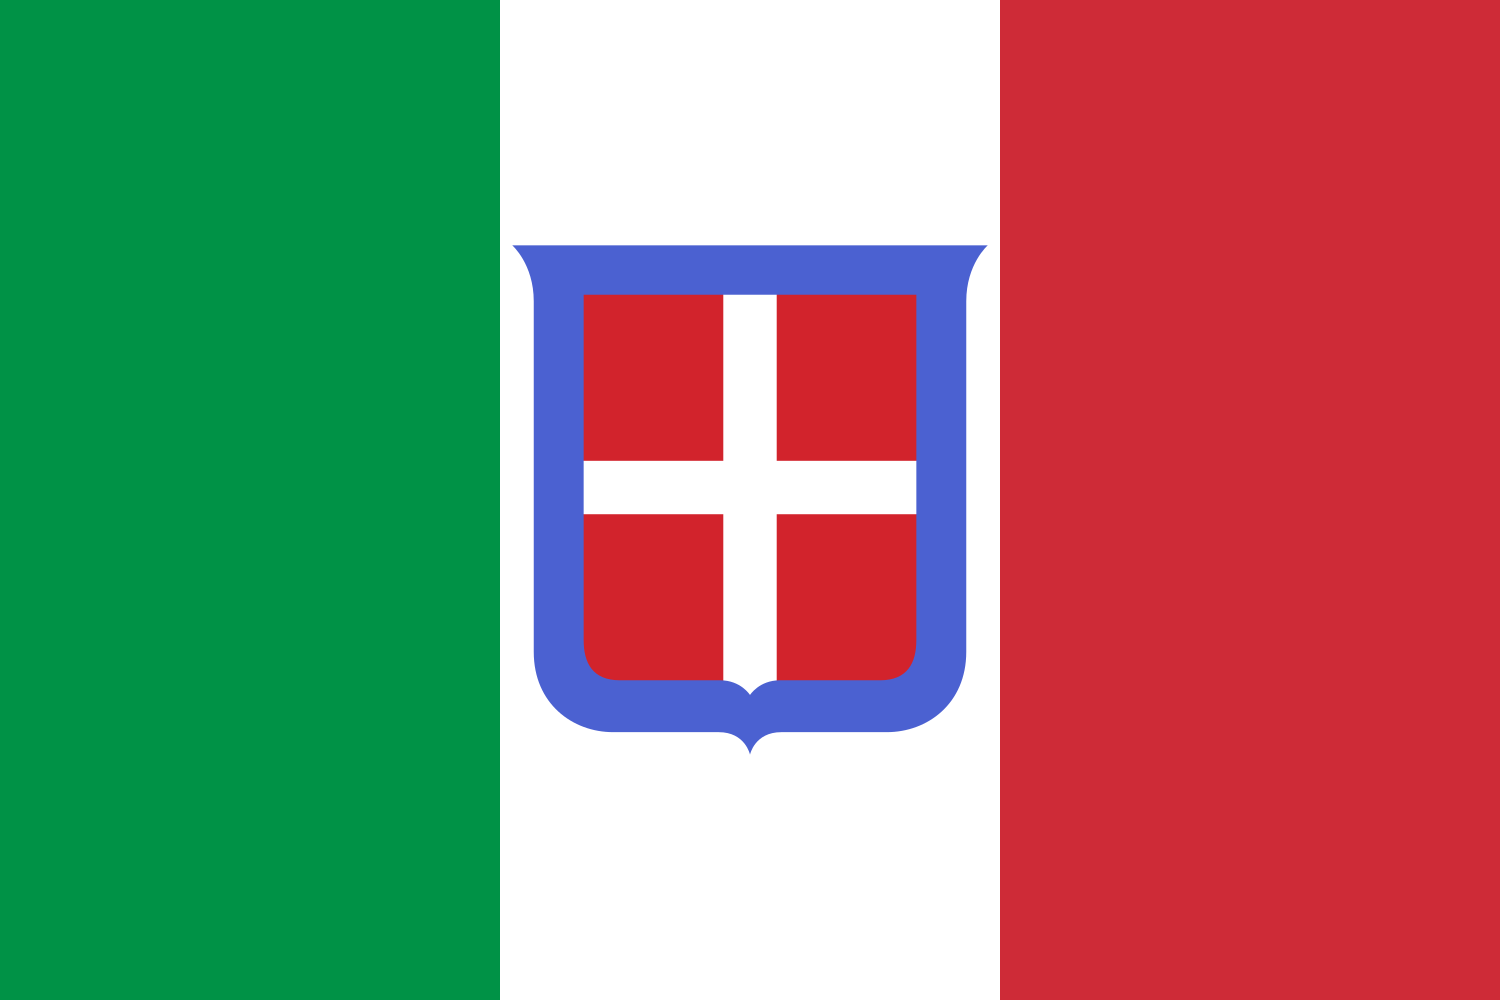 Kingdom of Italy |
5.615.000 | 6 | 1.950 | 18 | $102B | Profile |
| #8 |
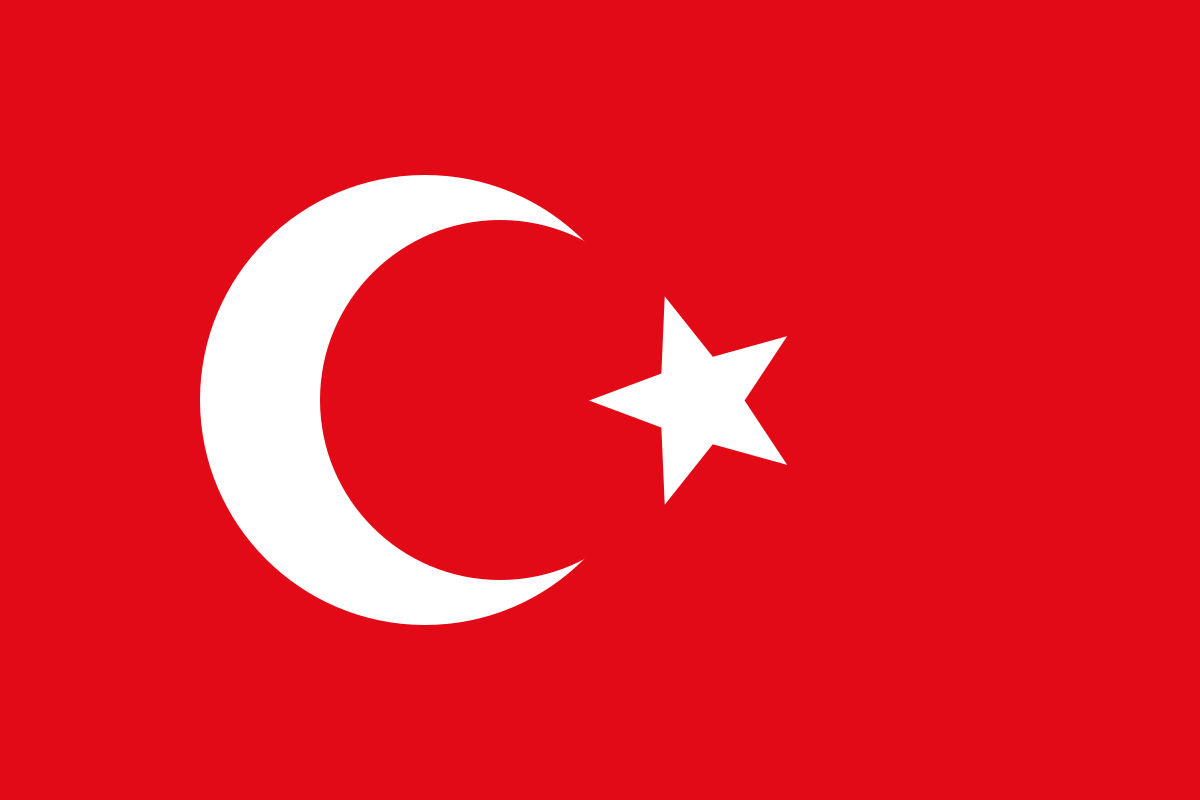 Ottoman Empire |
2.998.000 | 0 | 180 | 5 | $35B | Profile |
| #9 |
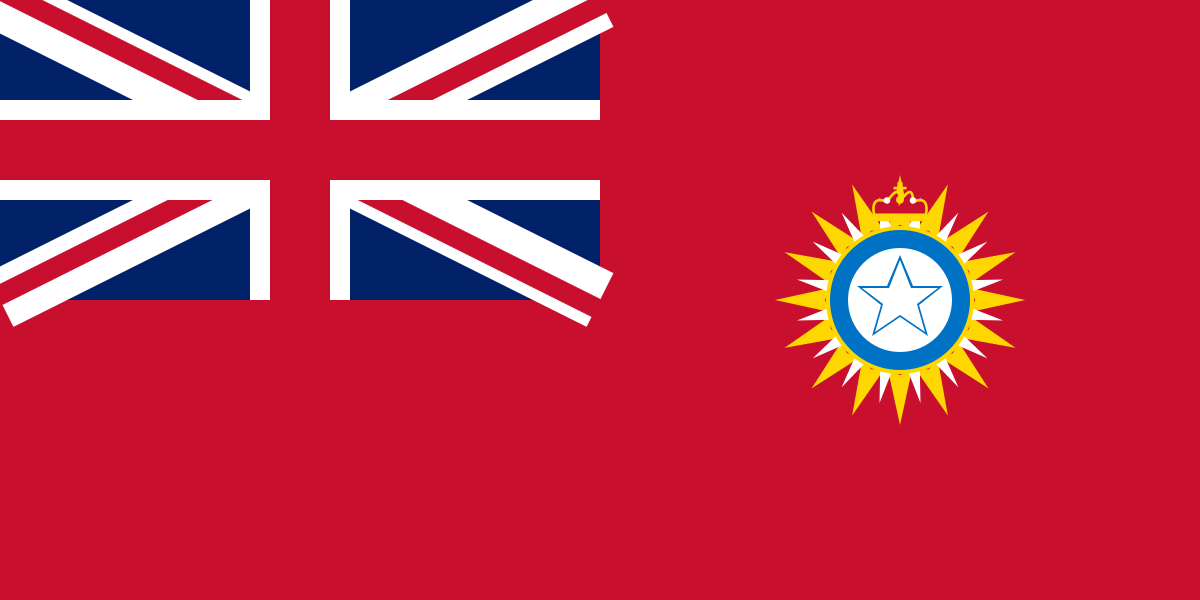 British Raj |
1.440.337 | 0 | 60 | 12 | $72B | Profile |
| #10 |
 Republic of China |
1.300.000 | 0 | 40 | 40 | $95B | Profile |
| #11 |
 Empire of Japan |
800.000 | 0 | 70 | 24 | $92B | Profile |
| #12 |
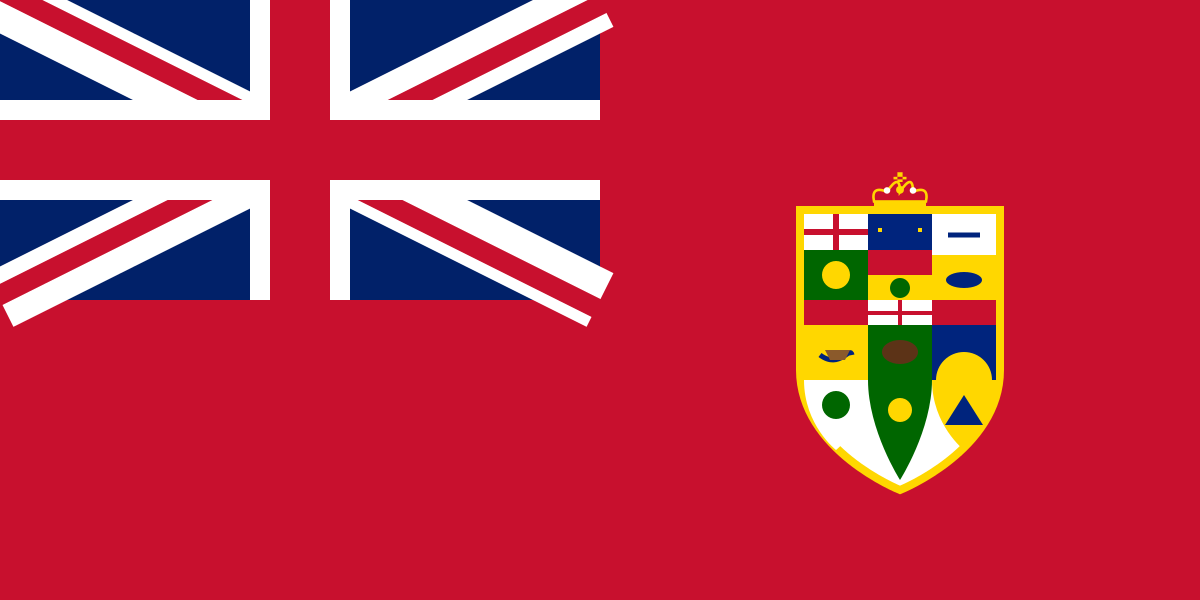 Dominion of Canada |
628.964 | 48 | 1.200 | 10 | $44B | Profile |
| #13 |
 Kingdom of Bulgaria |
900.000 | 0 | 90 | 0 | $8B | Profile |
| #14 |
 Kingdom of Romania |
833.000 | 0 | 140 | 4 | $14B | Profile |
| #15 |
 Commonwealth of Australia |
416.809 | 60 | 550 | 20 | $36B | Profile |
| #16 |
 Kingdom of Greece |
500.000 | 0 | 120 | 20 | $9B | Profile |
| #17 |
 Kingdom of Serbia |
500.000 | 0 | 90 | 0 | $7B | Profile |
| #18 |
 Kingdom of Belgium |
380.000 | 0 | 240 | 0 | $32B | Profile |
| #19 |
 Kingdom of Spain |
280.000 | 0 | 80 | 33 | $25B | Profile |
| #20 |
 Kingdom of the Netherlands |
250.000 | 0 | 70 | 26 | $16B | Profile |
| #21 |
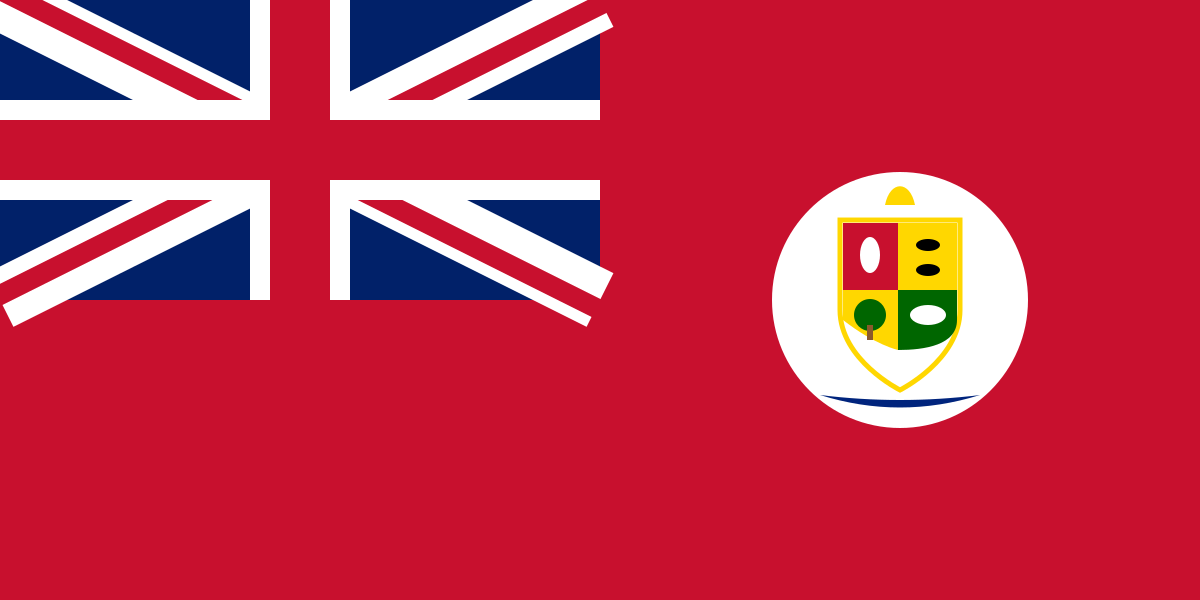 Union of South Africa |
228.900 | 0 | 140 | 5 | $18B | Profile |
| #22 |
 Kingdom of Sweden |
190.000 | 0 | 75 | 34 | $15B | Profile |
| #23 |
 Swiss Confederation |
250.000 | 0 | 40 | 0 | $11B | Profile |
| #24 |
 Ethiopian Empire |
250.000 | 0 | 0 | 0 | $4B | Profile |
| #25 |
 United Mexican States |
190.000 | 0 | 25 | 4 | $14B | Profile |
| #26 |
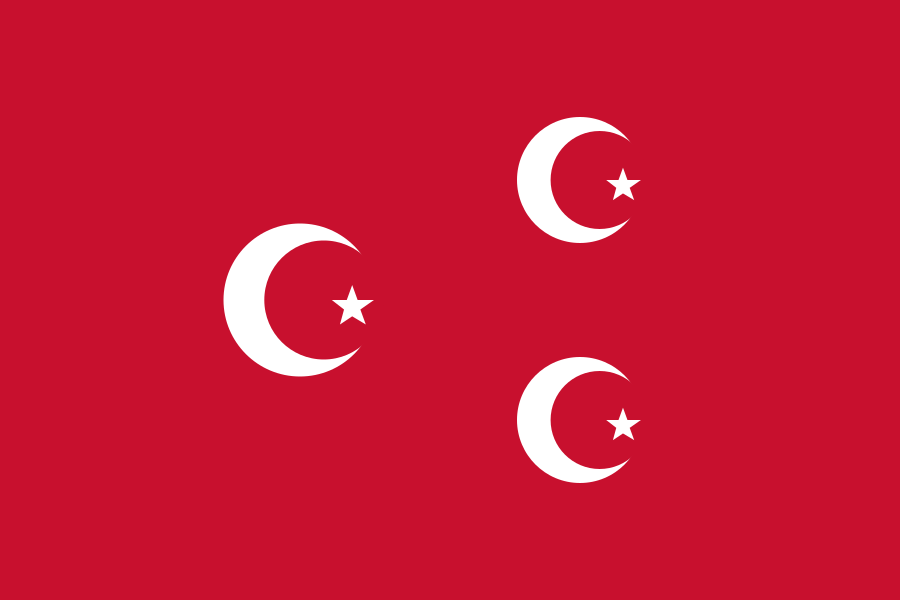 Sultanate of Egypt |
100.000 | 16 | 220 | 14 | $20B | Profile |
| #27 |
 First Brazilian Republic |
75.000 | 0 | 45 | 28 | $26B | Profile |
| #28 |
 Argentine Republic |
55.000 | 0 | 40 | 28 | $24B | Profile |
| #29 |
 French Indochina |
100.000 | 0 | 35 | 10 | $20B | Profile |
| #30 |
 Dominion of New Zealand |
124.211 | 0 | 120 | 4 | $10B | Profile |
| #31 |
 Portuguese Republic |
120.000 | 0 | 30 | 15 | $7B | Profile |
| #32 |
 Dutch East Indies |
46.000 | 0 | 40 | 15 | $30B | Profile |
| #33 |
 Kingdom of Norway |
80.000 | 0 | 35 | 17 | $8B | Profile |
| #34 |
 Republic of Chile |
45.000 | 0 | 30 | 24 | $13B | Profile |
| #35 |
 Kingdom of Denmark |
65.000 | 0 | 36 | 19 | $7B | Profile |
| #36 |
 Kingdom of Siam |
40.000 | 0 | 50 | 16 | $7B | Profile |
| #37 |
 British Malaya |
18.000 | 0 | 20 | 12 | $18B | Profile |
| #38 |
 British Burma |
34.000 | 0 | 18 | 8 | $14B | Profile |
| #39 |
 Qajar Empire |
70.000 | 0 | 0 | 0 | $5B | Profile |
| #40 |
 Belgian Congo |
30.000 | 0 | 12 | 10 | $10B | Profile |
| #41 |
 Emirate of Afghanistan |
70.000 | 0 | 0 | 0 | $2B | Profile |
| #42 |
 Republic of Peru |
28.000 | 0 | 20 | 10 | $6B | Profile |
| #43 |
 Emirate of Nejd and Hasa |
45.000 | 0 | 0 | 0 | $5B | Profile |
| #44 |
 Republic of Cuba |
22.000 | 0 | 10 | 6 | $6B | Profile |
| #45 |
 Kingdom of Montenegro |
50.000 | 0 | 0 | 0 | $1B | Profile |
| #46 |
 Republic of Colombia |
25.000 | 0 | 10 | 5 | $4B | Profile |
| #47 |
 United States of Venezuela |
20.000 | 0 | 6 | 4 | $4B | Profile |
| #48 |
 Oriental Republic of Uruguay |
16.000 | 0 | 10 | 6 | $3B | Profile |
| #49 |
 Republic of Bolivia |
20.000 | 0 | 8 | 0 | $3B | Profile |
| #50 |
 Republic of Ecuador |
14.000 | 0 | 5 | 3 | $2B | Profile |
| #51 |
 Republic of Paraguay |
14.000 | 0 | 5 | 4 | $1B | Profile |
| #52 |
 Principality of Albania |
10.000 | 0 | 0 | 0 | $1B | Profile |
WW1 Global Firepower & Imperial Military Intelligence
Command the Great War with authentic imperial cartography, 65M+ mobilized troops, dreadnought battle lines, and comprehensive strategic dossiers for all combatant empires.
Alliance System Dynamics & Coalition Warfare
Strategic analysis of the pre-war alliance web pitting the Triple Entente (British Empire, French Republic, Russian Empire) against the Central Powers (German Empire, Austria-Hungary, Ottoman Empire, Kingdom of Bulgaria). Imperial coalition dynamics dictated resource distribution across the Western, Eastern, Italian, Balkan, and Gallipoli/Middle Eastern theaters of operation.
Industrial Mobilization & Total War Logistics
Quantifying national industrial output: the transition from peacetime manufacturing to state-directed munitions boards, shell production quotas, agricultural rationing, and wartime rail transit. Over 65 million men were mobilized globally, requiring unprecedented logistical coordination in steel smelting, nitrogen fixation, and mechanized transport.
Dreadnought Dominance & Maritime Blockades
Evaluation of the Anglo-German naval arms race, super-dreadnought battle squadrons, and the catastrophic economic strangulation imposed by the British Grand Fleet's distant North Sea blockade. The counter-strategy of unrestricted submarine warfare (Kaiserliche Marine U-boats) revolutionized commerce raiding and accelerated American intervention.
📚 Historical Military Research, Alliance Doctrine & Archival Methodology Guide
1. Great War Alliance Systems: Triple Entente vs. Central Powers
The geopolitical configuration of 1914 was engineered through decades of bilateral treaties, secret military protocols, and imperial rivalries. The Triple Entente—originating from the Franco-Russian Alliance of 1894, the 1904 Entente Cordiale between Britain and France, and the 1907 Anglo-Russian Convention—encircled Central Europe. The Entente possessed overwhelming geographic scale, command of global sea lanes, access to colonial manpower, and the boundless credit reserves of the City of London and Wall Street. As the conflict broadened, the coalition expanded to incorporate the Kingdom of Italy (via the Treaty of London in 1915), the Kingdom of Romania, the Empire of Japan, Portugal, Greece, and, critically in April 1917, the United States of America.
Opposing them, the Central Powers were anchored by the German Empire and the Austro-Hungarian Dual Monarchy under the Dual Alliance of 1879, reinforced by the Ottoman Empire in November 1914 and the Kingdom of Bulgaria in October 1915. The Central Powers possessed significant interior lines of communication, allowing rapid rail redeployment between the Western Front in Flanders and the Champagne, the Eastern Front in Galicia and Poland, and the southern Alpine front along the Isonzo. However, they were crippled by an acute lack of domestic raw materials—specifically natural rubber, copper, crude oil, and organic nitrates for explosives—and suffered devastating domestic malnutrition under the Entente naval blockade.
2. 1914–1918 Industrial Mobilization & Trench Warfare Doctrine
The initial military expectations of 1914 anticipated a short, offensive war dictated by the German Schlieffen-Moltke Plan and French Plan XVII. However, the collision of massive conscript armies with modern rapid-fire weapons—specifically the Maxim and Vickers machine guns, magazine-fed repeating rifles, and quick-firing field artillery such as the French Canon de 75 mm modèle 1897—shattered conventional infantry doctrine. Following the Battle of the Marne and the subsequent "Race to the Sea," both belligerent coalitions dug thousands of miles of fortified, mutually supporting trench systems spanning from the Swiss border to the North Sea.
Breaking this tactical deadlock required transforming national societies into total war economies. Industrial mobilization was supervised by wartime ministries like Britain’s Ministry of Munitions under David Lloyd George and Germany’s Supreme War Bureau (Kriegsamt) under the Hindenburg Programme. Millions of women entered industrial factories producing high-explosive artillery shells, poison gas canisters (chlorine, phosgene, mustard gas), barbed wire, and machine guns. Total war meant victory no longer rested purely on battlefield maneuvers, but on economic endurance, agricultural self-sufficiency, and industrial throughput.
3. Evolution of Weaponry: Artillery, Dreadnoughts, Early Armor & Aviation
The First World War acted as a violent catalyst for technological innovation across all combat dimensions:
- Artillery Dominance: Responsible for an estimated 60% to 70% of all combat casualties, artillery evolved from direct visual aiming into complex scientific gunnery. Tactics advanced to include rolling/creeping barrages, flash-spotting, sound-ranging, and predicted fire without preliminary registration, maximizing operational surprise. Super-heavy siege howitzers like Germany’s Big Bertha (420 mm) and Austria-Hungary’s Škoda 305 mm dismantled frontier fortifications at Liège and Namur.
- Dreadnought Fleets & Commerce War: Inspired by HMS Dreadnought in 1906, massive all-big-gun battlecruisers and battleships anchored naval strategy. Although the decisive clash at the Battle of Jutland (1916) yielded ambiguous tactical losses, it reaffirmed British strategic command of the Atlantic sealanes. Germany’s asymmetric reply—unrestricted submarine warfare utilizing U-boats—sank millions of tons of merchant shipping but fatally provoked American entry into the war.
- Landships & Armored Tactics: To conquer no-man's-land across barbed-wire belts and machine gun nests, the British Landships Committee developed the Mark I tracked tank, debuting at Flers-Courcelette in September 1916. By 1917 at Cambrai and 1918 at Amiens, massed armored assaults proved tank doctrine was viable. Concurrently, France introduced the Renault FT, whose rotating turret, rear engine, and driver-forward layout set the universal architectural standard for all future tanks.
- Combat Aviation: Beginning as fragile reconnaissance scouts, aircraft quickly evolved with Anthony Fokker's synchronization gear into dedicated pursuit fighters (Fokker Dr.I, SPAD S.XIII, Sopwith Camel). By 1918, strategic multi-engine bombers like Britain's Handley Page O/400 and Germany's Gotha G.V attacked industrial centers and rail hubs far behind frontline battle lines.
4. Archival Data Methodology & Statistical Normalization
Our historical military database indexes 52 combatant nations, sovereign empires, dominions, and colonial territories. To maintain scholarly accuracy, armed forces metrics represent peak wartime mobilization (standing active armies combined with trained reserves and colonial levies called to the colors between August 1914 and November 1918). Economic metrics reflect peak wartime Gross Domestic Product (GDP) benchmarked in 1990 International Geary-Khamis dollars, derived from the historical research of Angus Maddison, Stephen Broadberry, and Mark Harrison. Artillery numbers encompass heavy field guns, siege mortars, and quick-firing field pieces, while naval figures highlight major dreadnought, pre-dreadnought, battlecruiser, and cruiser battle lines.
Frequently Asked Questions: World War I Military Intelligence
The German Empire mobilized approximately 13,250,000 soldiers throughout the war, representing over 80% of its eligible male cohort. The Russian Empire mobilized the largest single standing mass of personnel, totaling roughly 12,000,000 to 15,000,000 soldiers before imperial collapse and the 1917 Bolshevik Revolution, followed by the British Empire with approximately 8,900,000 troops mobilized from the United Kingdom, India, Canada, Australia, and New Zealand.
The British naval blockade severed the Central Powers from international trade, cutting off access to overseas fertilizers, nitrates, non-ferrous metals, and grain imports. Despite breakthroughs such as the Haber-Bosch process for synthetic ammonia, German industrial productivity fell by over 40% by 1918. In contrast, the Entente utilized Anglo-American capital markets to import millions of tons of raw materials and munitions from North America, proving that industrial sustainability was decisive.
Both the British Admiralty and the German Imperial Navy operated under "fleet-in-being" doctrines. Dreadnoughts were extraordinarily expensive national prestige capital ships whose loss could shift the naval balance overnight. The growing threat of sea mines, torpedo boat destroyers, and submarines in coastal choke points made naval commanders cautious. Consequently, Britain maintained its distant North Sea blockade from Scapa Flow, while Germany redirected its naval strategy toward submarine warfare.
Historical monetary figures are adjusted for purchasing power parity (PPP) using the 1990 International Geary-Khamis dollar standard established by the Maddison Project. This methodology neutralizes wartime hyperinflation, arbitrary fixed wartime exchange rates, and post-war currency collapses, enabling an objective apples-to-apples comparison of economic output across the British, German, Russian, Austro-Hungarian, and Ottoman empires.